Educational Innovation
- About EI
- EI Opportunities
- Curricular Analytics
- Resources
Curricular Analytics is a tool developed to visualize and analyze curricula. At UC San Diego, the Office of Educational Innovation is using Curricular Analytics to identify areas to improve the university's degree plans.
Curricular Analytics is developed by Damour Systems and the University of Arizona. Research has shown that higher degree complexity, as calculated by Curricular Analytics, is highly correlated with decreased graduation rates.
Access a collection of interactive dashboards built with Curricular Analytics.
When working with Curricular Analytics, there is an important distinction between curricula and degree plans.
Curricula represent the courses required solely by major requirements, without any courses for general education requirements or electives to meet the 180-unit requirement.
Degree plans represent a term-by-term plan of courses that satisfy both the major requirements and college general education requirements. For UC San Diego, these plans are manually put together by college advisors and published annually for every major by every college. These are the same plans publicly available at plans.ucsd.edu.
There are also two main metrics used to quantify the difficulty of a curriculum or degree plan.
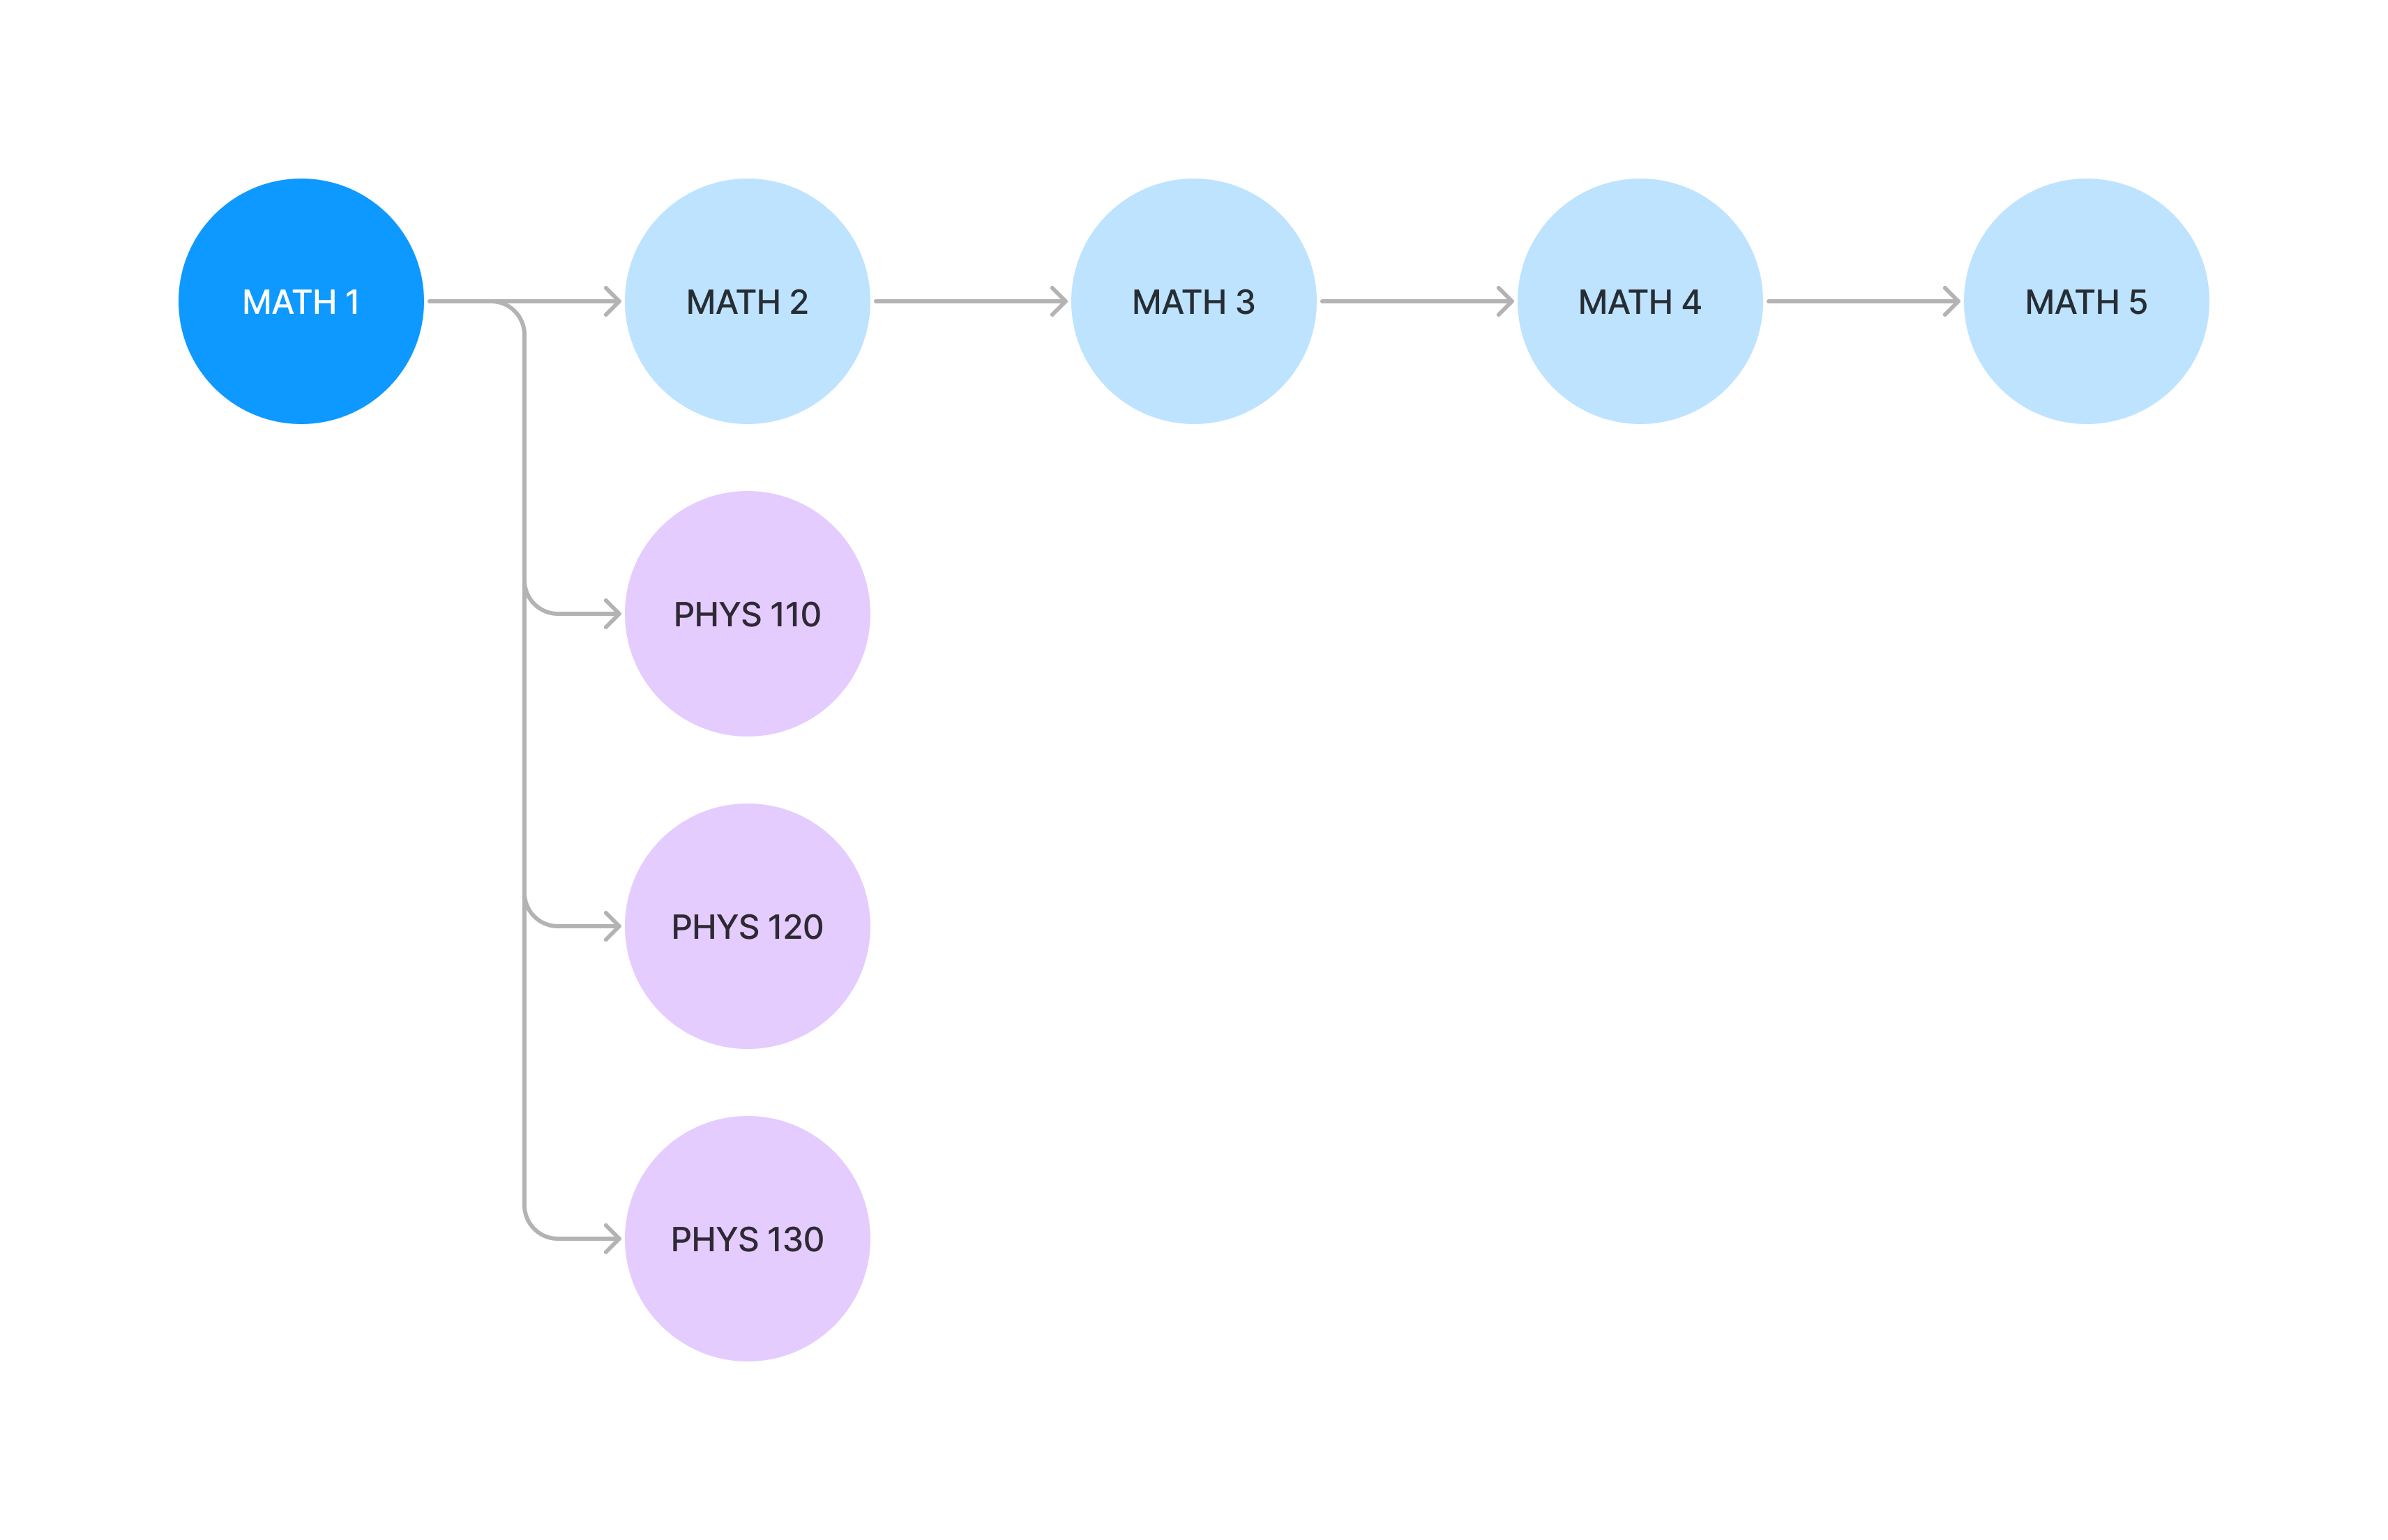
Complexity represents the structure of a curriculum's prerequisites, and it accounts for two ways to measure the impact of failing a given course: the number of courses in its longest sequence (the delay factor), and the number of courses that require the course to be taken (the blocking factor). Curricular Analytics has found that lower complexity is correlated with greater graduation rates.
The following fictional example illustrates a curriculum with high complexity because MATH 1 is in a long sequence MATH 1–5 and is required by many PHYS courses. If a student fails MATH 1, not only does this push back the rest of the MATH sequence courses, but the student also cannot start taking PHYS courses for another quarter.
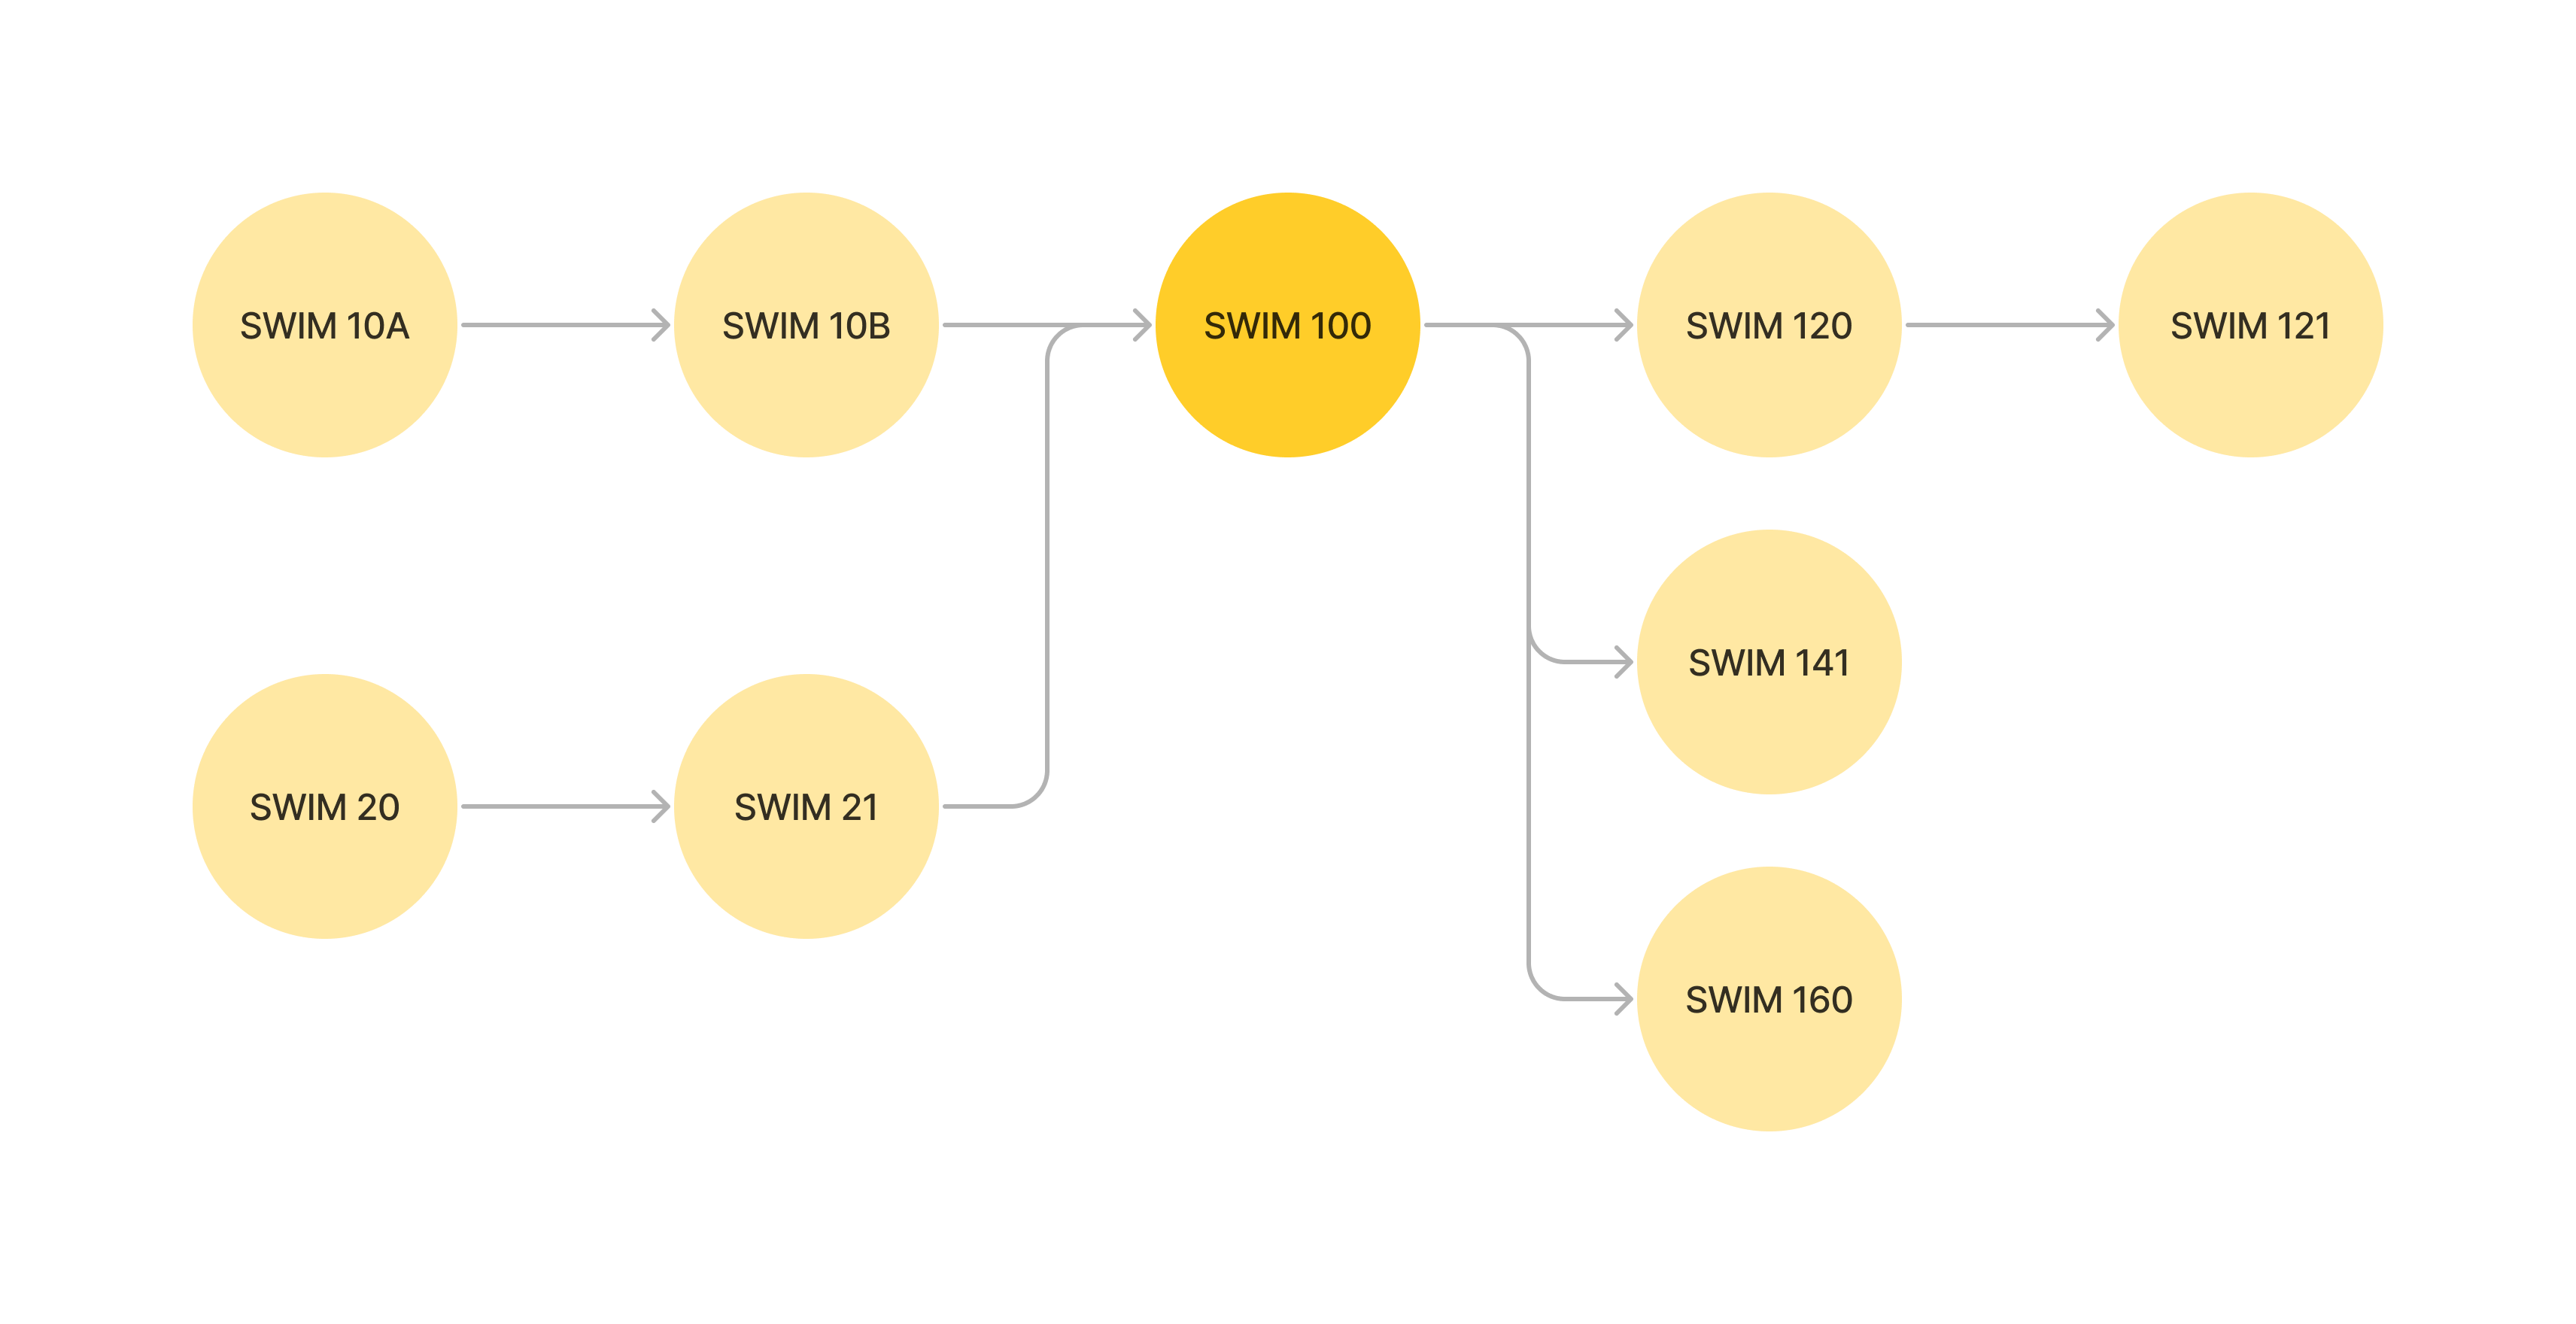
Centrality represents how much of a choke point a course is. In the example below, a lot of lower-division courses culminate in one introductory upper-division course, SWIM 100, that then is a prerequisite of more upper-division electives. SWIM 100 is therefore a course with high centrality because many courses funnel in and out of it due to prerequisites.
Curricular Analytics has more detailed descriptions about their terminology and metrics on their website.
We uploaded degree plans and curricula to Curricular Analytics' website to take advantage of their visualization framework. Links to the curriculum and degree plans for every major are listed by year in this Tableau view.
Using Curricular Analytics, we computed the complexities and centralities of every major-college pair across the years. We've made multiple data visualizations to help analyze and compare different majors and discover how they evolve over time.
Access to these Tableau views is restricted. To request access, visit the Curricular Analytics training page and fill out the access request form.